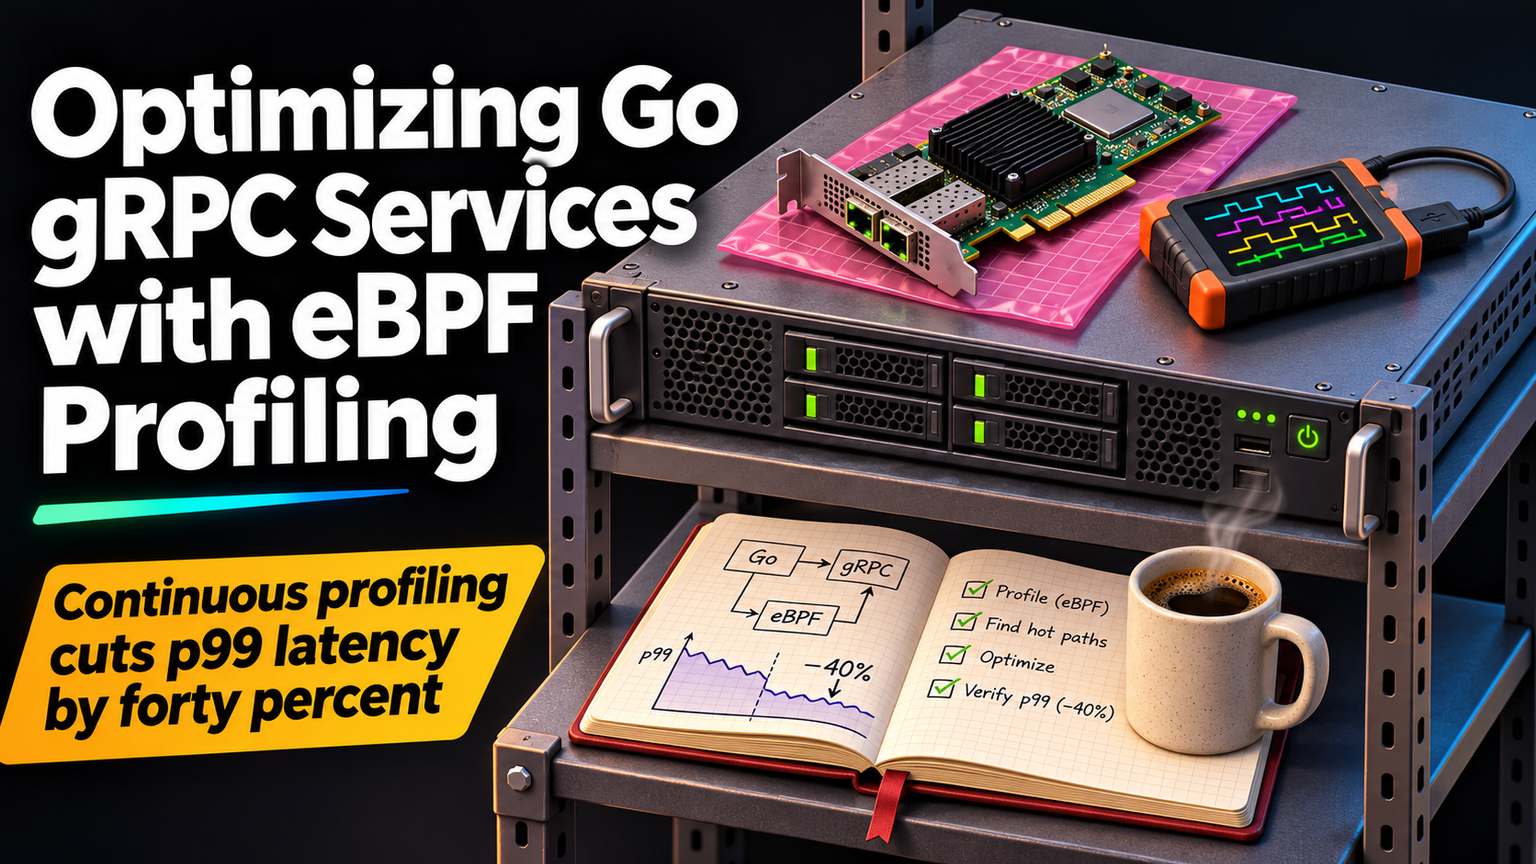
Your Go gRPC service runs fine in staging. In production, latency spikes appear without clear traces. Traditional profilers add overhead and miss kernel-level contention. eBPF changes this by letting you inspect running systems safely, without code changes or restarts.
Why Standard Profiling Falls Short
pprof and Delve work well for CPU and memory analysis in Go. But they require instrumentation, sampling, or process pauses. In high-throughput gRPC services, the act of profiling can distort the very behavior you're measuring. Kernel calls, lock contention, syscall latency, and network stack delays remain invisible.
"eBPF lets you ask questions of the kernel that were previously impossible to answer without kernel modules.
— Brendan Gregg
eBPF Basics for Go Developers
eBPF runs sandboxed bytecode in the kernel. You attach programs to tracepoints, kprobes, uprobes, or USDT probes. For Go, uprobes on runtime functions or USDT probes compiled into the binary let you trace goroutine scheduling, GC cycles, and channel operations without modifying source.
💡
TipCompile Go with -ldflags=-compressdwarf=false to keep function names readable in eBPF stack traces.
Profiling gRPC Latency End-to-End
Target the full request path: network receive, protobuf unmarshal, business logic, marshal, network send. Use uprobes on net.Conn.Read/Write, google.golang.org/grpc internal handlers, and your service methods. Correlate with TCP retransmits via tracepoints on tcp_retransmit_skb.
Tools That Bridge Go and eBPF
| Tool | Focus | Go Integration |
|---|---|---|
| bpftrace | One-liners, ad-hoc tracing | USDTS, uprobes on Go symbols |
| bcc | Python scripts, complex logic | Requires manual symbol mapping |
| Pixie | Auto-instrumentation | Native Go support, no code changes |
| Parca | Continuous profiling | eBPF-based, stores pprof-compatible profiles |
| Cilium/Hubble | Service mesh observability | gRPC-aware, L7 visibility |
ℹ️
NotePixie and Parca are the fastest paths to value. Both deploy as DaemonSets and auto-discover Go binaries.
Real-World Pattern: Detecting Head-of-Line Blocking
A gRPC service showed p99 latency of 800ms despite p50 at 12ms. pprof showed flat CPU. eBPF tracing on socket recvmsg revealed the issue: a single slow consumer caused TCP receive buffer buildup, blocking all streams on the connection. The fix: per-stream flow control tuning and max concurrent streams limits.
Production Safety Checklist
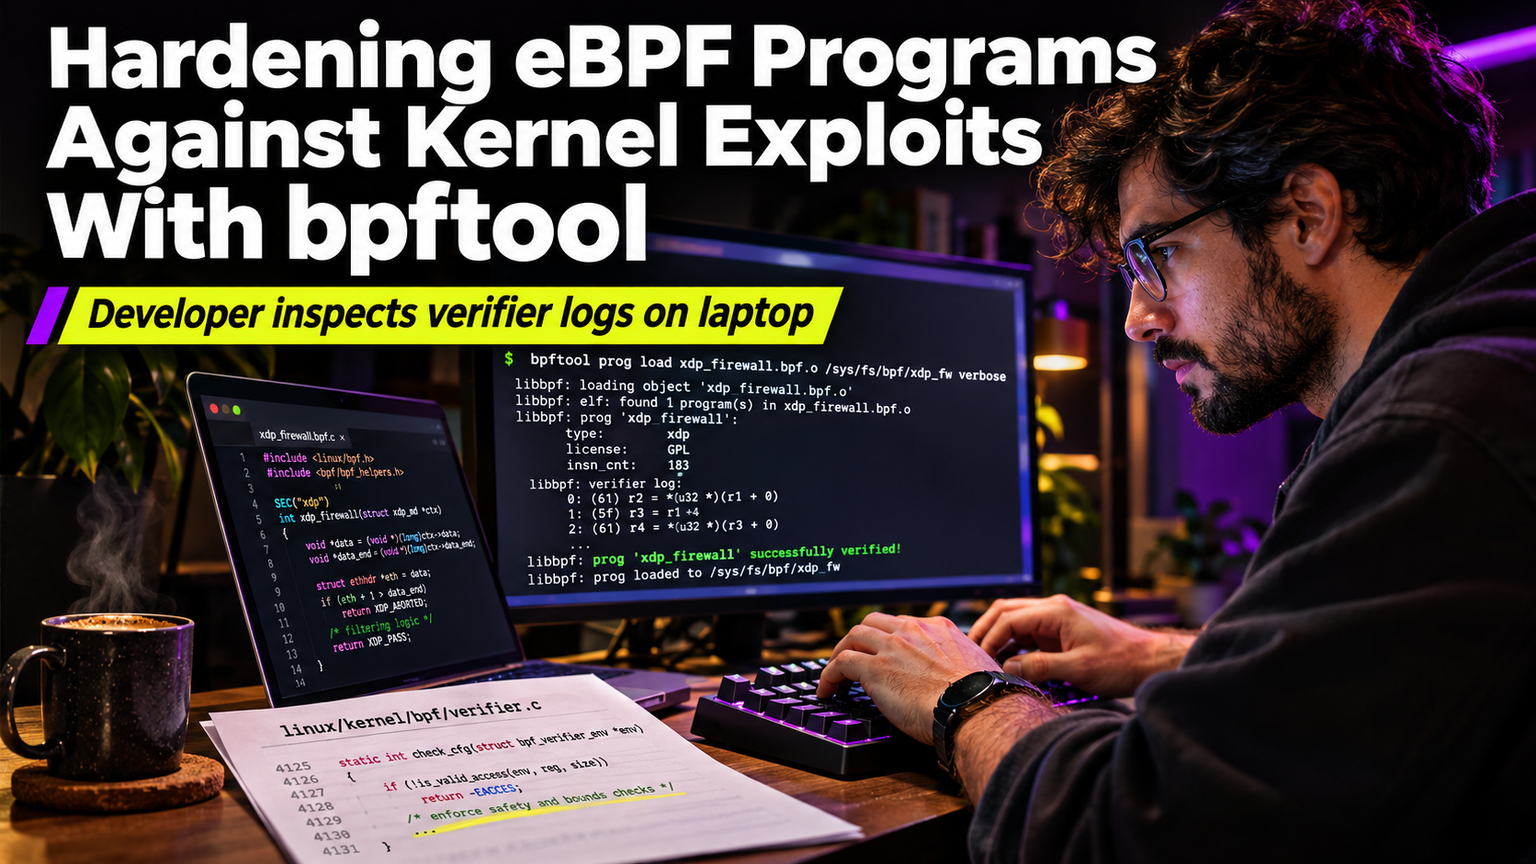
eBPF is safe by design but operational discipline matters. Verify kernel version >= 5.10 for BTF and CO-RE support. Limit probe frequency to avoid overhead. Use BPF_MAP_TYPE_RINGBUF for high-volume events. Test in staging with production-like load. Monitor eBPF program CPU via bpftool prog show.
⚠️
WarningAvoid kprobes on unstable kernel functions. Prefer tracepoints, USDT, or uprobes on your own binaries.
Next Steps
Deploy Parca or Pixie in your cluster today. Add USDT probes to your Go build: go build -tags=ebpf -ldflags="-compressdwarf=false". Instrument one hot gRPC method. Correlate eBPF latency histograms with your RED metrics. You'll find bottlenecks pprof never showed.